- Daily Chartbook
- Posts
- Daily Chartbook #139
Daily Chartbook #139
Catch up on the day in 29 charts
Welcome back to Daily Chartbook: macro market charts, data, and insights pulled from various sources around the Internet by a solo retail investor.
1. Real rates vs. oil prices. "The breakdown in the relationship between crude and real interest rates may result in a decrease in oil prices".

2. Oil price forecast. Goldman lowered its price path for Brent to $75 from $80 to reflect "a modest softening to our 2023 balance, with the bulk of the revision due to a lower path for long-dated prices. Introducing monthly forecasts, we now expect Brent to rise gradually to $100/bbl by December, where we expect it to stay in 2024".

3. China PPI vs US CPI. Falling producer prices in China bode well for US inflation.

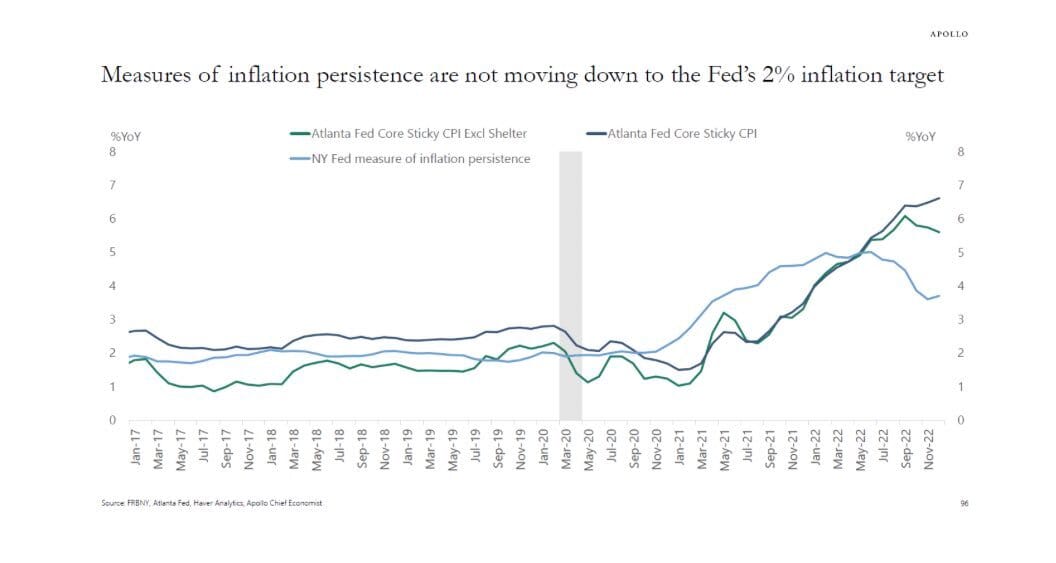
4. Sticky inflation. "The risks are rising that inflation will be sticky at the 4% to 6% level and may even reaccelerate over the coming months. .. markets should be paying attention".

5. Fed's needs. "The Fed needs the larger trade deficit, a product of the strong dollar, to drive inflation lower directly (import prices and CPI) and indirectly (pressuring the tradeable goods sector and, in turn, labour)".

6. Real funds rate gap. "Difference in real funds rate gap of -7.9% at beginning of current tightening cycle (blue) was widest in history; if Fed closes gap by 9.4% by end of cycle (thru rate increases/lower inflation), it will be largest closure on record (green)".

7. Small businesses. "Smaller companies have seen massively tighter credit".

8. CEO confidence (I). CEO confidence "ticked higher in 1Q23; still pessimistic in level terms, but a relatively strong move from 32 to 43".

9. CEO confidence (II). "Uptick in CEO Confidence in 1Q23 ended longest streak of declines since mid-1980s".

10. Consumer sentiment. "U of Mich's Consumer Sentiment continued to improve in Feb, with perception of current conditions offsetting worsening future expectations. Yellow dotted line is inflation (inverted)...as inflation fell, current feelings had a vibe shift".

11. Inflation expectations (I). "Consumer inflation expectations rebounded on higher gas prices". One-year expectations bounced to 4.2% from 3.9% while five-year expectations remained flat at 2.9%.

12. Inflation expectations (II). "Uncertainty over short-run #inflation expectations ticked up recently and continues to be notably elevated, indicating the potential for continued volatility in expected year-ahead inflation. In contrast, uncertainty over long-run inflation receded".

13. Consumer strength (I). "We saw signs of strengthening in consumer spending in both retail and services in January, accelerating from December. Total Bank of America credit and debit card spending per household was up 5.1% YoY in January, vs. 2.2% YoY in December".

14. Consumer strength (II). "This increase partly reflects the comparison with an Omicron-impacted January 2022, but we also think an increase in minimum wages and social security may be helping consumers, along with the stellar labor market…".

15. Consumer strength (III). "More broadly, the data suggests that while lower income consumers are pressured, they still have solid cash buffers and borrowing capacity. Even for the lowest income cohorts this should provide support for some time yet…".

16. Cyclical cost-conditions. "I’m not betting against this tightening cycle’s ability to produce a material slowdown. This index leads eco activity by about 15 months".

17. 60/40 back. "60-40 portfolio up 6.8% YTD, best start since ‘91".

18. Call options volume. "More than 40 million call-option contracts changed hands in a single day in early February—the highest level on record and nearly topping 2022’s daily average volume for puts and calls combined".

19. Sentiment indicator. "Bullish sentiment back to more extreme levels so look for a short-term correction to work off some of the exuberance".

20. Bull & bear indicator. At 4.4, the indicator is at its "highest since Feb'22, on bullish credit & EM flows, and impressive stock market breadth."

21. Active managers. "Bears have been slowly capitulating since the Oct lows--bearish active managers' two-week stock exposure is now almost neutral vs. -100% four months ago (i.e. fully short)".

22. Seasonality. "Historically, the second half of February tends to be challenging for U.S. stocks".

23. Soft landing. "Goldman soft landing basket has been trading more like a V-shaped recovery since the start of the year".

24. Breadth thrust. "Sector breadth has just experienced a strong breadth thrust signal. Over 90% of sectors are now above their 200-day moving average".

25. Q4 earnings (I). With 69% of the S&P 500 reported, 69% have topped earnings estimates while 63% have beaten revenue expectations.

26. Q4 earnings (II). Blended earnings and revenue growth for Q4 are -4.9% and +4.6%, respectively.

27. Fwd P/E. SPX forward P/E of 18 is below its 5-year average but above its 10-year average.

28. Earnings expectations. "Earnings expectation resets may be further along than realized, largely pricing in an earnings recession. There is no change to our ongoing view that S&P 500 earnings will prove resilient to a mild recession outcome".

29. Earnings deviation. And finally, “earnings estimates keep falling, but they are still very extended from the long-term growth trend”.

Have a great weekend!
Reply