- Daily Chartbook
- Posts
- Daily Chartbook #230
Daily Chartbook #230
Catch up on the day in 29 charts
Welcome back to Daily Chartbook: the day’s best charts & insights, curated.
1. Logistics Managers Index. "For the fourth consecutive month, the overall LMI has reached a new all-time low, reading in at 45.6 and contracting for only the second time in the history of the index."

2. Financial conditions. "The nominal GS US Financial Conditions Index eased by 11.3bp to 99.56 over the last week, mostly due to higher equity prices, and the real GS US FCI eased by 12.2bp to 99.26."

3. Labor normalization. "Both labor shortage & job cut related mentions are falling during S&P 500 company earnings calls."

4. ISM Manufacturing. ISM Manufacturing fell to 46 (vs. 47 expected) in June from 46.9 in May. Employment, new orders, backlogs, and delivery times are all in contraction. Prices paid eased to 41.8 from 44.2.

5. Construction spending. US construction spending rose by 0.9% in May, the strongest increase since January.

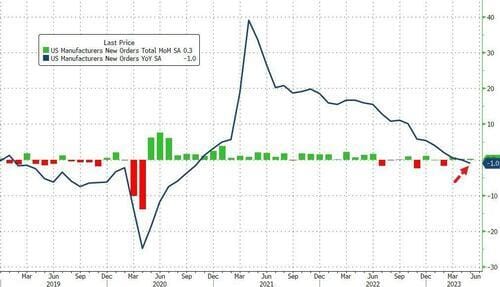
6. Factory orders (I). "Headline US factory orders rose just 0.3% MoM in May (well below the +0.8% MoM exp), dragging the YoY change into the red (down 1.0% YoY) for the first time since Oct 2020." YoY orders have declined for a record 8 straight months.

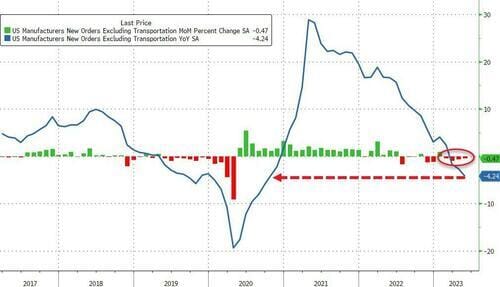
7. Factory orders (II). "Worse still, core factory orders fell for the 4th straight month in May, down 4.24% YoY (worst since Sept 2020)."

8. Dot plot. "Updated Fed Dot Plot. Looks like some of Fed officials if not all now expecting more rate hikes in ‘23."

9. Oil positioning. Net managed money positioning in oil is in the 6th percentile.

10. Bond flows. "The first half of 2023 has seen $121bn flow into fixed income funds — the largest inflow since H2 2021 and a sharp reversal of the $85bn outflow in 2022."

11. Yield curve. The 2s/10s Treasury curve has now been inverted for a year straight.

12. VIX vs. HYG. "The May/June meltdown in market volatility has opened a big gap versus high yield, which is usually highly correlated to volatility."

13. Nasdaq 100 vs. Treasuries. "Equity markets, particularly mega-cap tech companies, have completely ignored the rising duration risk this year."

14. Risky vs. safe. "Risky vs. safe assets fund flows are positive."

15. Tactical indicator. "Citi's tactical indicator for US stocks--our POLLS index (Positioning, Optimism, Liquidity, Leverage, Stress)--jumped by 6 points Friday to 19, marking the largest 1d increase since May 2019."

16. Retail buying. "Retail investors saw the greatest buying in 15mths [in June], with buying in single stocks coming back; Equity ETFs saw strong inflows as well."

17. Retail rotation. Retail investors have been rotating out of fixed-income ETFs and into equity ETFs since April.

18. Investor flows. "June ETF flows were a return to risk-on trade; equity ETFs made up ~80% of inflows on rolling 1m basis; large and mid-cap ETFs took up >50% of flows in June and nearly $19 billion in inflows last week."

19. Smart money flows (I). Last week, BofA "clients were net buyers of US equities (+$5.5bn; largest week of inflows since October 2022)."

20. Smart money flows (II). "Clients bought stocks in eight of the 11 sectors, led by Comm. Services (record weekly inflows) and Tech. Comm. Services has the longest buying streak of any sector (last eight weeks)."

21. Hedge fund flows. "Overall Prime book was modestly net sold in June (-0.5SDs one-year) as gross trading activity decreased for the first time in five months, driven by long sales outpacing short covers ~2.3 to 1."

22. Hedge funds industry exposure. According to JPM, hedge fund exposure to Semiconductors is in the 98th percentile. Exposure to banks is in the 1st.

23. Hedge funds vs. semis. "Net positioning in Semis & Semi Equip has significantly rebounded from trough levels seen at the start of the year—when HFs were net short the group—but still sits below historical averages."

24. Sector flows. The divergence between flows in Tech and Energy continues.

25. Consolidated positioning. "Deutsche Bank’s positioning indicator is increasingly bullish."

26. SPX valuations. "Although many US stocks look overvalued at current price levels, movements in valuations can be seen as actually in line with the macroeconomic environment to some extent if we take into account bond volatility in addition to US real interest rates."

27. SPX price target. "Inflation likely to fall faster than consensus expects. .. Economic not sliding into recession but ‘sliding into an expansion’ .. Earnings estimates are beginning to rise .. Raising [year-end] 2023 $SPX Target to 4,825 from 4,750."

28. EPS estimates. "S&P 500 earnings estimates for 2023 and 2024 are down 4.7% and 2.5% respectively since the start of the year."

See:
29. Top 10 vs. worst 10. And finally, “the fact that the 10 worst performers are often much more of a lead weight than they have been so far this year...does tend to show that the market is not lethally narrow.”

Thanks for reading!
Reply