- Daily Chartbook
- Posts
- Daily Chartbook #256
Daily Chartbook #256
Catch up on the day in 30 charts
Welcome back to Daily Chartbook: the day’s best charts & insights, curated.
1. New listings. "New listings of homes for sale fell 16.5% year over year [in the 4 weeks ending Aug 6]."

2. Active listings. "Active listings (the number of homes listed for sale at any point during the period) dropped 17.9% from a year earlier, the biggest drop since February 2022."

3. Home prices. "The median home sale price was $381,225, up 3% from a year earlier. That’s the biggest increase since November. "

4. Rent prices. "The median U.S. asking rent in July was $2,038, just $16 below the record high set in August 2022. While rents are just shy of their all-time high, rent growth remains sluggish. The median asking rent was up just 0.3% from a year earlier in July, compared with a 13.6% annual gain in July 2022."

5. Corporate cash. "Corporate cash levels have been declining, driven mostly by smaller firms in the S&P 500."

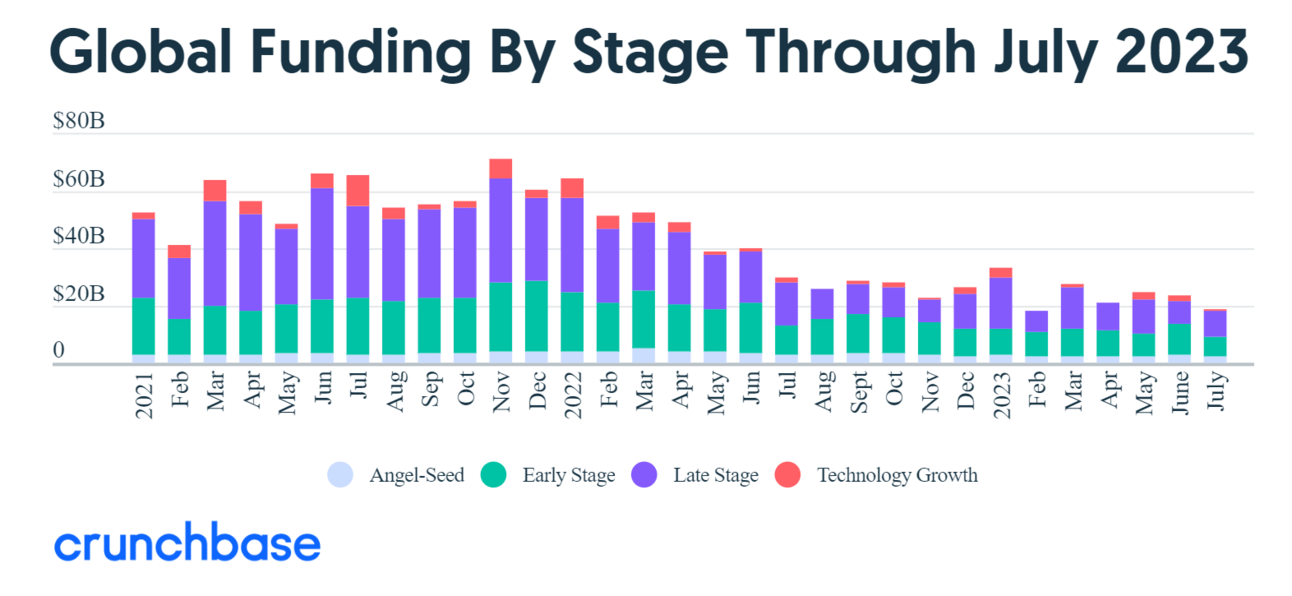
6. VC funding. “All funding stages — seed, early and late — in July 2023 were down close to a third compared to a year ago. Notably, seed and early-stage funding hit its lowest amount in a single month since we began tracking the downturn in July 2022.”

7. Inflation expectations. "Longer term inflations expectations show rising concern over the persistence of inflation."
8. Inflation (I). Month-over-month: headline +0.2% (in-line), core +0.2% (in-line), supercore reaccelerates +0.2% (vs. +0.09% prev)

9. Inflation (II). Year-over-year: headline +4.7% (vs. 4.8% est), core +3.2% (vs. 3.3% est), supercore +4.13% (vs. 4.0% prev).

10. Inflation (III). "After 25 consecutive increases, YoY Shelter CPI has moved down for 4 straight months, from 8.2% in March (highest since 1982) to 7.7% in July. A continued move lower in Shelter inflation will have a big impact on overall CPI as Shelter represents more than a third of the index."
11. Inflation (IV). "Inflation is basically gone ex shelter."
See:
12. Inflation (V). "The Zillow numbers signal that the monthly rate of increase in primary/OER rents will fall to just above 0.3% by the end of the year, and to 0.2% next spring."
13. Jobless claims. "Initial jobless claims rose 21,000 last week to 248,000. The more important 4 week moving average rose 2,750 to 231,000. With a one week delay, continuing claims declined -8,000 to 1.684 million. On an absolute level, all of this remains very good."

14. Wage growth. The Atlanta Fed's Wage Growth Tracker increased to 5.7% in July from 5.6% in June. Growth for job-switchers and job-stayers were 6.4% (prev 6.1%) and 5.4% (unch), respectively.
15. Between-recession slowdown. "Many investors’ mistake in 2023 was expecting a 1H23 recession; we think that risk is 2024E and 2023 is just a slowdown."

16. MMF vs. small bank deposits. "The relative attractiveness of money market fund yields is a competitive threat to US banks, especially smaller financial institutions, and history shows that problem has a long runway if rates do not decline quickly."

17. M1 vs. commodities. "Global real M1 growth is one of the simplest measures of liquidity and it continues to rise; oil and other commodities should do likewise."

18. Commodity gains. "Commodity Spot Index from Bloomberg thus far looking at first quarterly gain since 1Q22."
19. Copper/gold vs. 10-year. “Historically, when discrepancies arise, the 10-year yield often gravitates towards the copper-gold ratio. This alligator may be swimming around with its mouth wide open for a while. In other words, rates remain high & headed higher.”
20. AAII. "Investor sentiment turned more bearish. Net % Bullish in the 77th percentile. Bearish +4.5%, Neutral -0.2%."
21. NAAIM. Active managers reduced exposure to equities for the second straight week, driving the NAAIM Exposure Index down to 65.5 from 78.5.

22. Index gamma. "S&P 500 Index gamma flips negative (-$1B) for the first time in 2023. Index desks are the most short gamma since October 20th, 2022, this is the shortest gamma in 10 months."

23. CTA supply. "Asymmetric Skew to the downside. CTA strategies remain sellers over the week in all scenarios."

24. Stock-specific risk. "Stock-specific risk (the percentage of stocks' risk/volatility that is not explained by traditional factors such as the market or size) has been rising this year."

25. Intra-stock correlation. "Intra-stock correlation among the S&P 500 has fallen significantly YTD."

26. Value vs. Growth. "Value stocks look attractive."

Industries vs. economic growth vs. inflation. "We see better-than-expected econ-growth and slowing but above-average inflation favoring Cyclical Value(bottom right) in 2H23."

Highs vs. lows. "Every day this week has brought more new lows than new highs but for now the trend in net new highs continues to rise. If that rolls over, tactical and cyclical risks would rise."

See:
Forward P/E vs. yields. "Despite the increase in real yields, the S&P 500 has been performing well, which could possibly suggest that the market is becoming overheated."
Forward P/E expansion. And finally, “the forward P/E ratio for the S&P 500 has expanded by 27%, which is shy of the average 44%. Even so, the timing for a valuation peak is about right. That doesn’t mean that equities need to peak, only that any further gains will need to be supported by earnings.”
Thanks for reading!
Reply